Assume that I have this counter, with the server scraping these metrics every 15 seconds.
vector_component_sent_events_total{component_id=~"sink.*"}
If the counter increases by 30. As shown in the picture below:
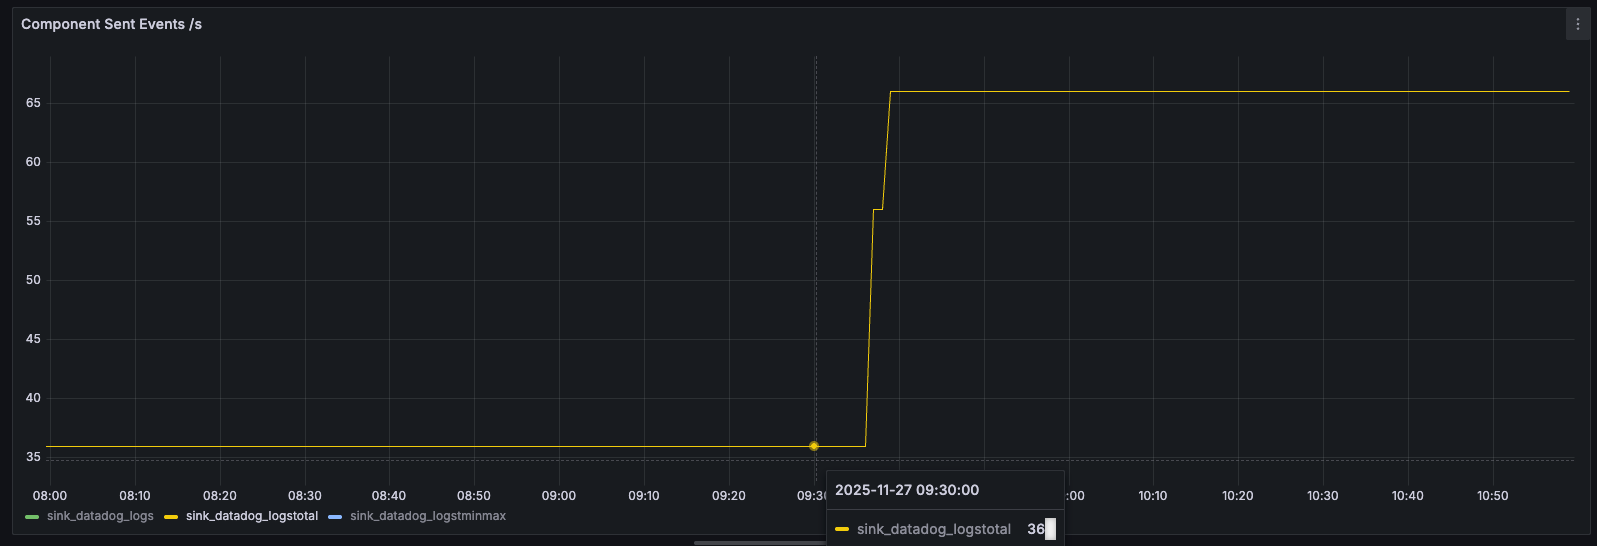
The counter increased from 36 to 66 as I expected because I sent 30 log lines to make it increase.
Now I’m trying to get this increase, so I found a increase function. I used this like so:
increase(vector_component_sent_events_total{component_id=~"sink.*"}[$__interval])
The min interval is set to 1m in Grafana, for the purpose of this query, it will be 1m and the increase happened during the period of 09:36:31 to 09:37:49.
The increase was 30 but why does the increase function show 40, I need to show an accurate number of events sent:
I am a new user so can only embed 1 image in a post. I will add a reply to this post with the result of the increase query which shows 40.
Any help will be appreciated, thanks in advance
