Hello Community,
I am deploying Prometheus as a DeploymentSet in AWS EKS using the official Helm chart. Although I have set the data retention size to 1 GB (via --storage.tsdb.retention.size=1GB), the memory usage of the Prometheus server pod continues to exceed this limit and keeps increasing over time.
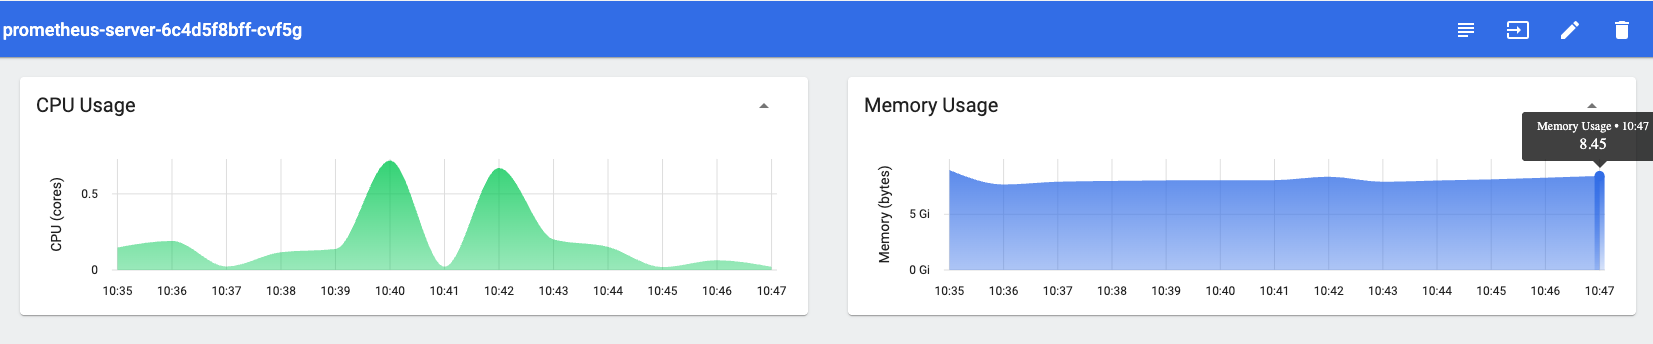
Even after restarting the pod, the memory consumption does not reset to a lower value—it starts at a higher baseline (e.g., 6 GB) and continues to grow. This behavior suggests that the retention setting is not effectively limiting memory usage as expected.
Below are few snippets of the configuration
resources for prometheus server
server:
resources:
requests:
cpu: 500m
memory: 4Gi
limits:
cpu: 2
memory: 12Gi
prometheus data retention is set as below
server:
retention: “6h”
retentionSize: “1GB”
Arguments to prometheus server
–storage.tsdb.retention.time=6h
–storage.tsdb.retention.size=1GB
–config.file=/etc/config/prometheus.yml
–storage.tsdb.path=/data
–web.console.libraries=/etc/prometheus/console_libraries
–web.console.templates=/etc/prometheus/consoles
–web.enable-lifecycle
–web.enable-remote-write-receiver
–storage.tsdb.wal-compression
–web.enable-admin-api
Has anyone else experienced this? Are there any recommended settings or tweaks to better control memory usage in Prometheus under these conditions?
Any suggestions or help would be highly appreciated!
Thanks !!